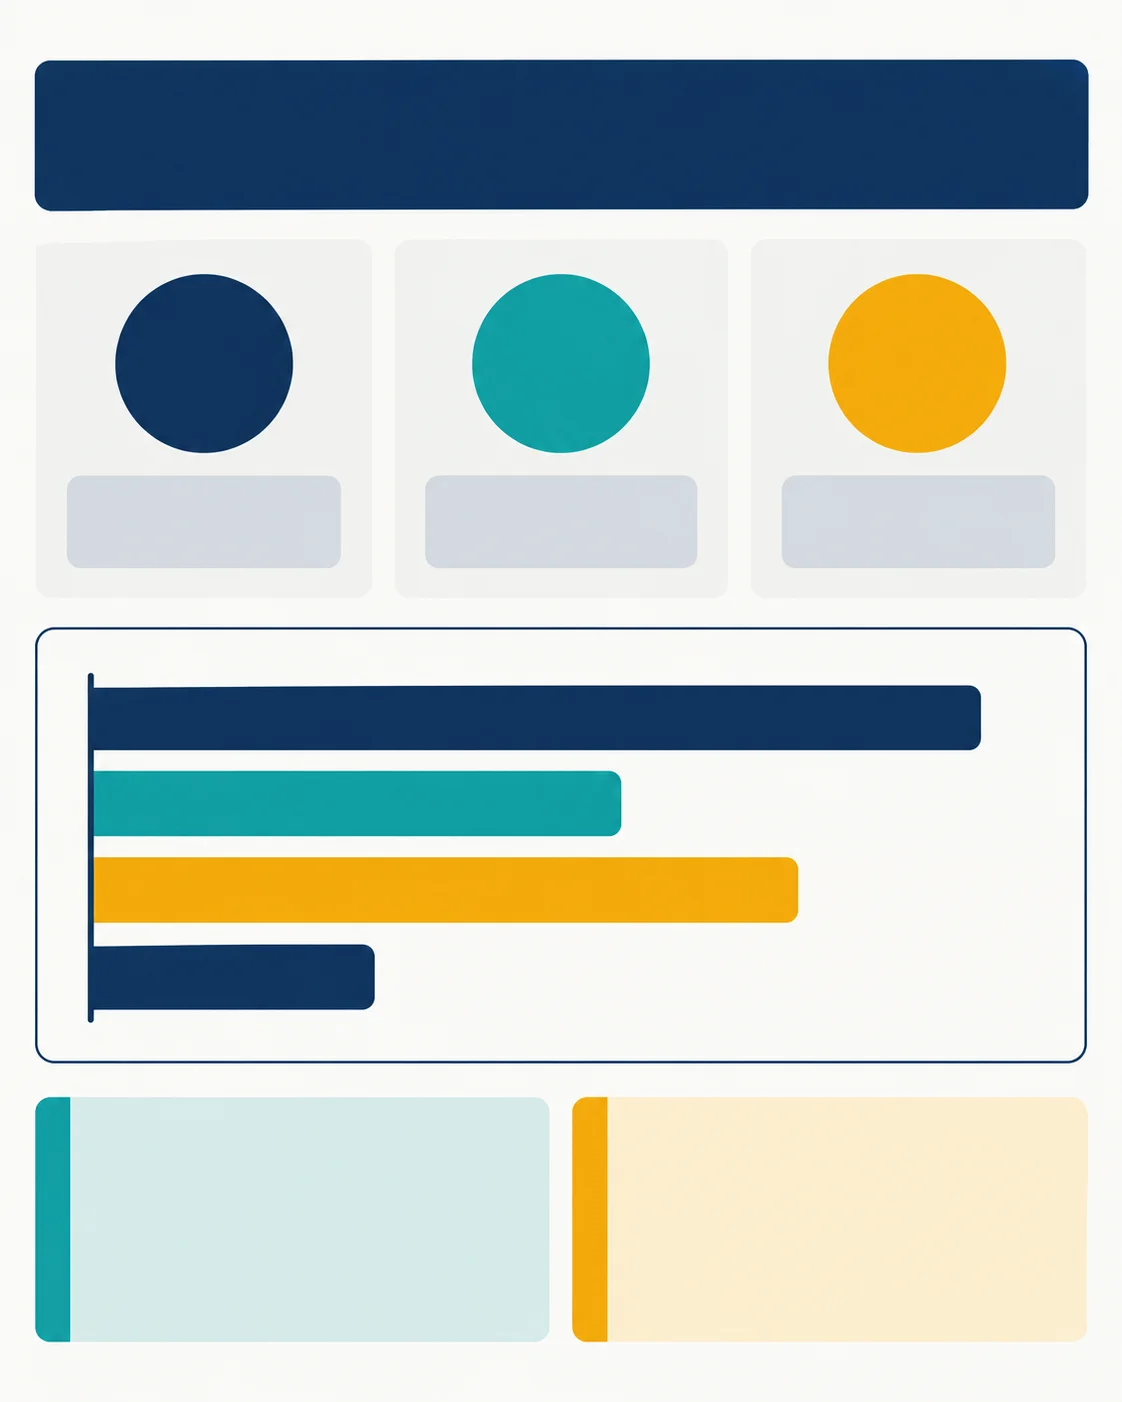
Design a text-free 4:5 infographic layout using {{HIERARCHY}} for {{VERIFIED_DATA}}. Include a blank title area, three empty number cards, one chart area appropriate to the comparison type, a methodology-note area and a source area. Use a clear grid, high-contrast {{PALETTE}} and shape cues in addition to colour. Generate no words, numbers, logos or fact-specific icons. Do not invent data, scales or comparisons. Produce a visual template to be populated with accurate text and charts in a design tool.
Choose the chart type from the question and data before generation. Add numbers, labels, sources and alt text manually; check contrast and never distinguish series by colour alone.